
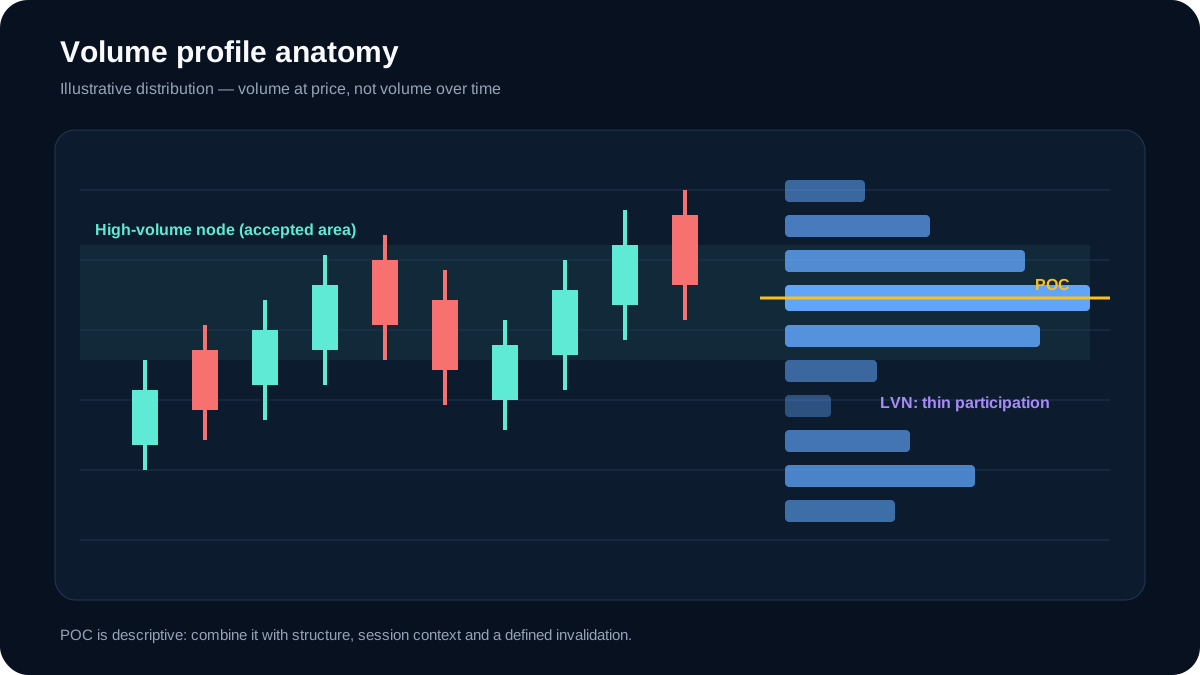
Original AlgoVistra educational diagram; illustrative only, not live market data.
Price charts show where a market traded; volume adds information about how much activity was reported. Volume profile reorganizes that activity by price level instead of time.
Volume profile shows how much trading activity occurred at each price level over a specific period. Unlike standard volume bars, which show volume over time, volume profile shows volume at price. This reveals where the market actually did business.
Data caveat: volume on a chart means different things in different markets. Spot forex commonly has no single consolidated exchange-volume feed, so the profile may be a proxy; a crypto profile may describe only one venue's matching engine; futures have exchange-reported volume. Check what your tool actually measures before reading the levels literally.
What Is Volume Profile?
Volume profile is a charting tool that displays total volume traded at each price level. Imagine a histogram turned sideways. The longest horizontal bar represents the price level with the most activity.
This matters because price can move anywhere, but volume reveals where participants agreed value existed. Those levels often become important in the future.
How to read the diagram: The POC is the price with the most measured volume in the selected profile. An HVN shows relatively heavy participation; an LVN shows relatively thin participation. The distribution is schematic, not an exchange data sample.
The Three Pillars of Volume Profile
1. Point of Control (POC)
The Point of Control is the price level with the highest traded volume in the lookback period. It represents the market's accepted fair value.
Why the POC matters:
- Price tends to revisit the POC because the most participants have positions there.
- The POC often acts as support in uptrends and resistance in downtrends.
- A decisive break away from the POC is read by some traders as a shift in accepted value.
How to trade the POC:
- If price returns to the POC and reacts, look for continuation trades in the direction of the trend.
- If price breaks through the POC with strong volume, the fair value may be shifting.
2. High Volume Nodes (HVN)
High Volume Nodes are price zones where significant trading activity occurred. They are the thick areas of the volume profile.
Characteristics of HVNs:
- Price tends to rotate inside HVNs because liquidity is high.
- HVNs act as support and resistance.
- Breakouts from HVNs are sometimes read as slower but potentially more sustainable.
- When price is inside an HVN, expect choppy, range-bound action.
Trading HVNs:
- Range trade between the top and bottom of the HVN.
- Wait for a confirmed close outside the HVN before entering a breakout trade.
- Examine HVNs as candidate target or reaction zones when price moves through an LVN, then test that rule on the specific market and session.
3. Low Volume Nodes (LVN)
Low Volume Nodes are the thin areas between HVNs. They represent price zones where very little trading occurred.
Why LVNs matter:
- Price moves quickly through LVNs because there is little opposition.
- LVNs represent inefficient price zones.
- Breakouts through LVNs can be explosive.
- LVNs often act as magnets — price tends to move through them to reach the next HVN.
Trading LVNs:
- Use LVNs as continuation zones once price breaks out of an HVN.
- Avoid counter-trend entries inside an LVN.
- Use the next HVN beyond the LVN as a target.
Volume Profile Strategies
Strategy 1: Value Area Trading
The Value Area is a convention for describing the price range where the bulk of volume traded — commonly around 70% of the period's volume, often approximated as one standard deviation around the POC. Different platforms and instruments use different definitions, so confirm the exact rule for your tool and market before treating it as precise.
- Value Area High (VAH) — top of the value area, often acts as resistance.
- Value Area Low (VAL) — bottom of the value area, often acts as support.
In a balanced market, traders sell near VAH and buy near VAL, targeting the POC.
Strategy 2: Volume Profile Breakout
When price balances around the POC for an extended period, energy builds. A breakout with volume expansion through VAH or VAL can signal the start of a new trend.
Confirmation signals include:
- Breakout candle closes outside the value area.
- Volume is above average.
- Market structure confirms the move.
- The POC begins shifting in the breakout direction.
Strategy 3: Volume Profile With Market Structure
Volume profile is most powerful when combined with structure:
- Identify the trend using market structure.
- Locate the POC and value area on the higher timeframe.
- Drop to a lower timeframe for entries near VAL in an uptrend or VAH in a downtrend.
- Confirm with volume expansion in the trend direction.
Volume Profile Across Asset Classes
Forex — Liquid, consistent volume patterns. POC shifts gradually. Value areas are well-defined.
Crypto — Volume is spiky. POC can shift dramatically after events. LVNs are common and create fast moves.
Gold — Volume clusters around macro events. POC often aligns with psychological levels.
Common Mistakes
- Using too short a lookback period — volume profile needs enough data.
- Ignoring the trend — trade with the trend, not against it.
- Forgetting news — major events can invalidate strong volume levels.
- Treating levels as exact prices — POC, HVN, and LVN are zones.
How AlgoVistra Uses Volume Profile
AlgoVistra's AI engine detects volume profile components across markets:
- Real-time POC tracking
- HVN and LVN identification
- Multi-timeframe volume confluence
- Integration with market structure and macro context
You can ask questions like:
- "What is the volume profile saying about BTC/USDT?"
- "Where is the POC on EUR/USD 4H?"
- "Is price testing an HVN or LVN on XAU/USD?"
Volume profile becomes much more useful when it is combined with structure, news, and AI-driven context.
Data and testing notes
Volume definitions depend on the market and data source. The CME explanation of futures volume defines it as the number of contracts traded and cautions that a volume spike at a level does not by itself mean buyers arrived or price must bounce. Spot FX commonly lacks one consolidated exchange-volume feed, while a crypto profile may describe only the selected venue.
Record the venue, contract or pair, session, profile range, and whether the data is exchange volume or a proxy. Freeze the POC/HVN/LVN rule before testing reactions. The CFA Institute review of technical trading tests explains why apparent technical-rule performance must survive false-discovery controls, out-of-sample testing, and costs.
Disclaimer: AI trading assistants provide analytical insights for educational and informational purposes. They do not constitute financial advice. Always conduct your own research and use proper risk management.
Ready to Trade Smarter?
Get 10 AI chat messages per day on the free plan. No credit card required.
Multi-Timeframe Analysis: How to Align Daily, 4H, and 1H Charts
Learn how to use multi-timeframe analysis to identify trend direction, key levels, and better entry timing in forex, crypto, and gold markets.
May 28, 2026GuideGold Trading Analysis: XAU/USD Key Levels and Macro Context
How to analyze gold (XAU/USD) using macro context, key levels, market structure, and an AI trading assistant.
June 8, 2026GuideCrypto Trading with AI: BTC, ETH, SOL Analysis Workflow
A practical workflow for analyzing Bitcoin, Ethereum, and Solana with an AI trading assistant.
May 27, 2026