
Multi-Timeframe Analysis: How to Align Daily, 4H, and 1H Charts
Learn how to use multi-timeframe analysis to identify trend direction, key levels, and better entry timing in forex, crypto, and gold markets.
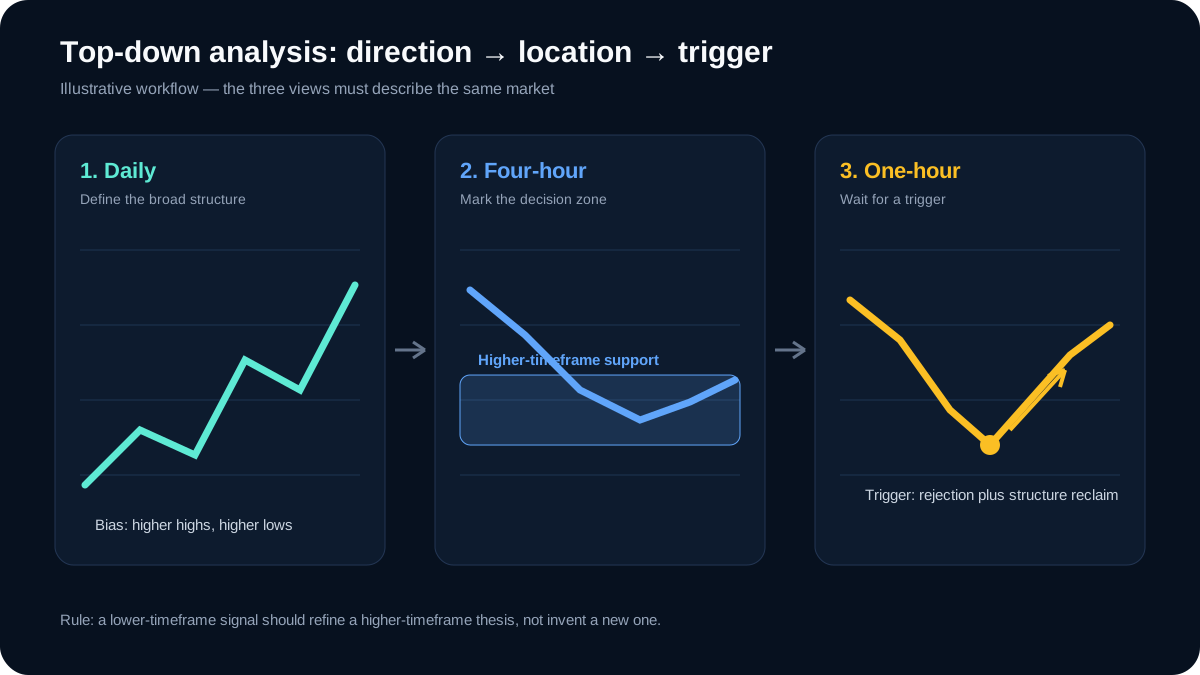
Original AlgoVistra educational diagram; illustrative only, not live market data.
One of the most common mistakes traders make is analyzing only one timeframe. A setup that looks perfect on the 15-minute chart can be heading straight into a major daily resistance zone. Multi-timeframe analysis solves this by showing you the bigger picture before you commit to a trade.
This guide explains how to align the daily, 4-hour, and 1-hour charts into a single coherent decision.
Why Multi-Timeframe Analysis Works
Markets are sometimes described as fractal: similar patterns appear on weekly, daily, 4H, and 1H charts, though practitioners differ on how reliable that analogy is. What is clear is that each timeframe represents a different group of participants:
- Daily/Weekly — longer-term structure and major levels
- 4H — active swing and position traders
- 1H — day traders and scalpers
- Lower timeframes — algorithmic and short-term traders
When multiple timeframes agree, setups become higher conviction. When they conflict, risk increases.
The Top-Down Approach
The most reliable method is top-down analysis. Start with the highest timeframe and work your way down.
Step 1: Identify the Trend on the Daily
Ask: what is the overall market structure? Is price making higher highs and higher lows, or lower highs and lower lows?
- Uptrend — higher highs, higher lows, bullish bias
- Downtrend — lower highs, lower lows, bearish bias
- Range — no clear directional structure, neutral bias
The daily trend is your directional filter. Most successful trades align with it.
Step 2: Find Key Levels on the 4H
On the 4H chart, look for:
- Swing highs and lows
- Previous support turned resistance, or resistance turned support
- Volume profile point of control (POC)
- Order blocks and fair value gaps
These are the levels where price is likely to react. Mark them on your chart.
How to read the diagram: The daily view supplies direction, the four-hour view supplies location, and the one-hour view supplies a trigger. The example is schematic; it does not represent a tested setup or current market.
Step 3: Time Entries on the 1H
Use the 1H chart to refine timing. Look for:
- Pullbacks to 4H/daily support in an uptrend
- Retests of broken resistance that now acts as support
- Candlestick confirmation such as engulfing bars or pin bars
- Break of structure in the direction of the higher timeframe
The 1H should confirm what the daily and 4H already suggest.
Example: Bullish Setup in EUR/USD
Imagine the daily chart shows a clear uptrend with price above a rising 50-day moving average. On the 4H, price has pulled back to a previous resistance-turned-support zone. On the 1H, you see a bullish engulfing candle forming at that support with expanding volume.
All three timeframes align: daily bullish, 4H support held, 1H confirmation. This is a higher-quality setup than anything seen on the 1H alone.
Example: Crypto Breakout Trap
A 15-minute chart might show BTC/USDT breaking above a local high. But the 4H chart shows price approaching major resistance and the daily chart is in a downtrend. The breakout may be a trap — a candidate to test rather than assume. Multi-timeframe analysis keeps you out of low-probability trades.
Common Multi-Timeframe Mistakes
- Starting on the lowest timeframe — this leads to fighting the trend.
- Ignoring the daily — the daily trend dominates most setups.
- Using too many timeframes — daily, 4H, and 1H are usually enough.
- Forcing trades — if timeframes conflict, there is no trade.
How AI Helps
An AI trading assistant can summarize multi-timeframe context in one prompt. Instead of flipping between charts, you can ask:
- "What is the daily, 4H, and 1H structure on GBP/USD?"
- "Are the timeframes aligned for a EUR/USD long?"
- "What key levels should I watch on XAU/USD across timeframes?"
The assistant can point out potential conflicts between timeframes and explain which one is in control; treat that as an interpretation to verify against the chart.
Practice Without Risk
Multi-timeframe analysis is a skill. Practice by marking levels on each timeframe, predicting how price should react, and then watching what happens. You do not need to trade. You can use the AI assistant to compare your read with its analysis and build confidence over time.
AlgoVistra supports multi-timeframe analysis for forex, crypto, and gold pairs through natural-language chat.
A small test you can reproduce
Choose one market and write the daily-bias rule, four-hour zone rule, and one-hour trigger before opening the test period. Review candles sequentially so future bars remain hidden. Log every eligible setup, skipped setup, cost assumption, and invalidation. Compare the full workflow with the one-hour trigger alone on a later sample. That tests whether the higher-timeframe filters add information rather than merely producing a convincing story.
The CFA Institute backtesting overview explains rolling tests, look-ahead bias, and structural breaks. The NBER paper Foundations of Technical Analysis shows why subjective chart patterns need systematic definitions. These sources support the method, not the profitability of the illustrative setup above.
Disclaimer: AI trading assistants provide analytical insights for educational and informational purposes. They do not constitute financial advice. Always conduct your own research and use proper risk management.
Ready to Trade Smarter?
Get 10 AI chat messages per day on the free plan. No credit card required.
Volume Profile Trading: HVN, LVN & POC Explained
Master volume profile trading with our complete guide to High Volume Nodes, Low Volume Nodes, and Point of Control.
June 1, 2026GuideGold Trading Analysis: XAU/USD Key Levels and Macro Context
How to analyze gold (XAU/USD) using macro context, key levels, market structure, and an AI trading assistant.
June 8, 2026GuideCrypto Trading with AI: BTC, ETH, SOL Analysis Workflow
A practical workflow for analyzing Bitcoin, Ethereum, and Solana with an AI trading assistant.
May 27, 2026