
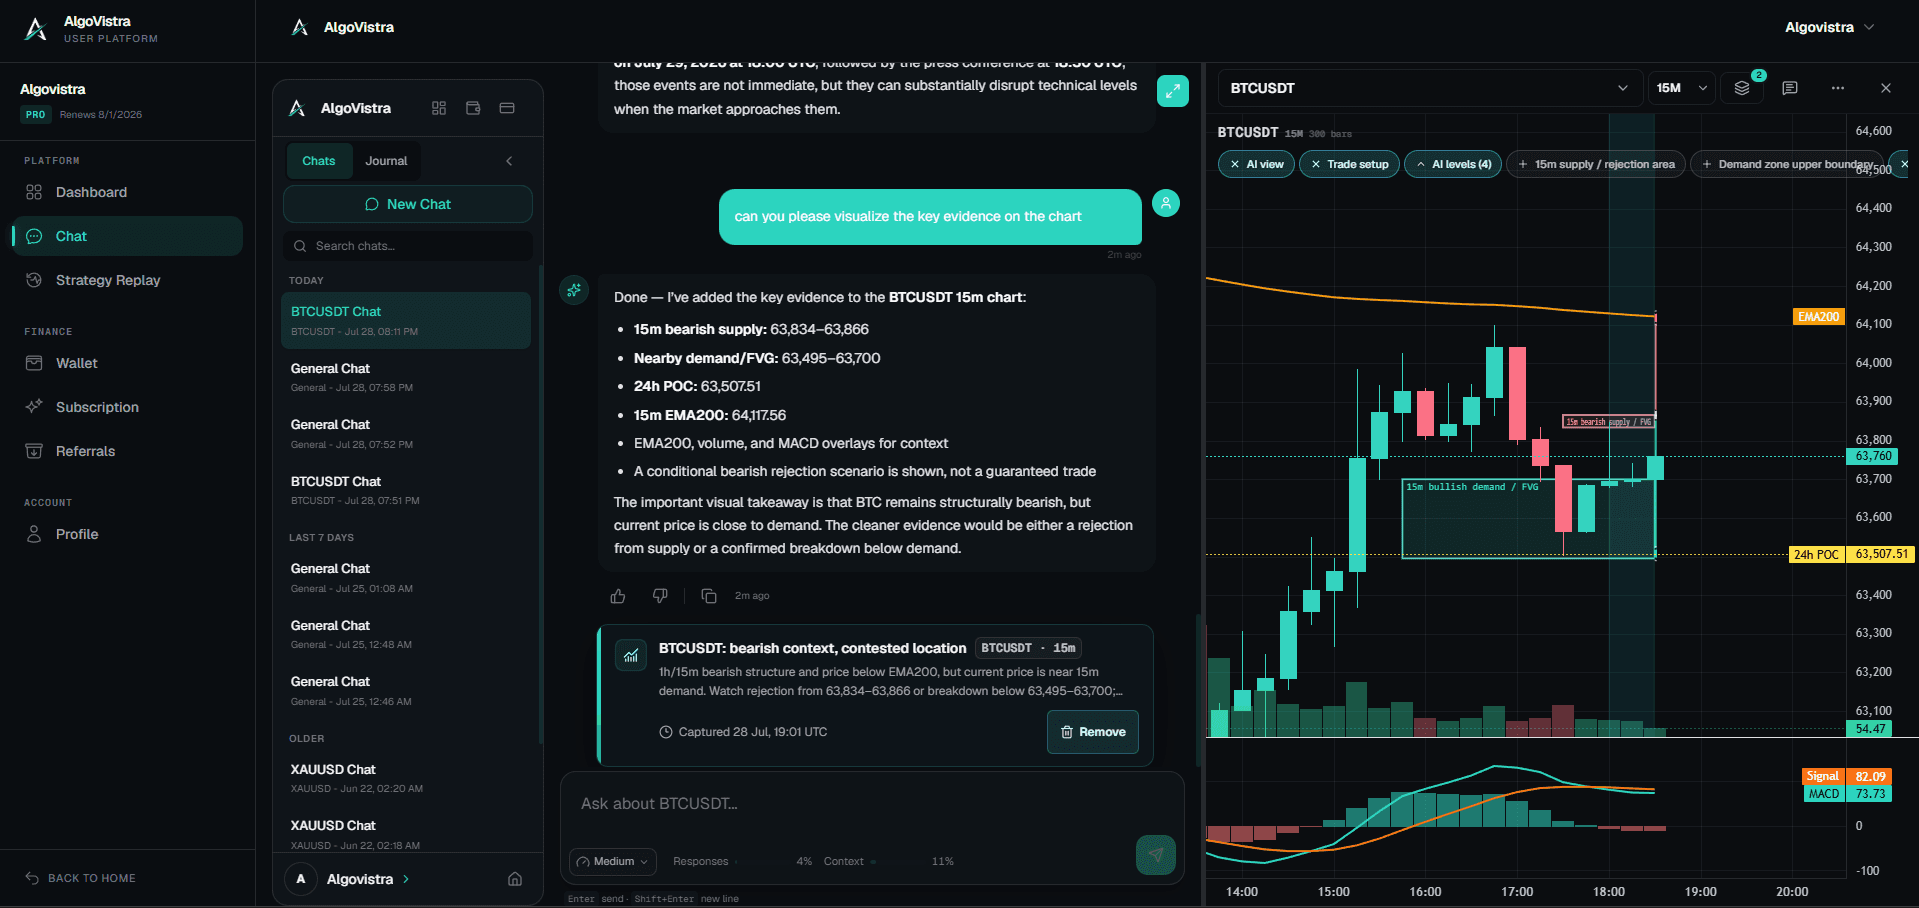
AlgoVistra product screenshot with sample workspace data; it is not verified trading performance.
Gold behaves differently from many currency pairs and crypto assets. Interest rates, inflation expectations, the dollar, investment flows, central-bank activity, and risk sentiment can all matter. A useful XAU/USD process therefore combines macro context with technical structure instead of assuming one chart pattern explains every move.
This guide shows how to analyze XAU/USD with both lenses.
Why Gold Is Different
A few characteristics make gold unique:
- Real-asset status — gold is a store of value, especially during uncertainty.
- Inverse correlation with real yields — when real interest rates fall, gold often rises.
- Dollar influence — a stronger dollar usually pressures gold.
- Central bank buying — long-term demand from official sectors.
- Psychological levels — round numbers attract attention; which ones matter depends on the prevailing price range.
These features mean that traditional technical analysis still works, but it works best when paired with macro awareness.
The Macro Factors That Move Gold
Real Yields
Real yields (nominal yield minus inflation expectations) are widely considered a major driver. When real yields fall, gold tends to rise because the opportunity cost of holding it drops. When real yields rise, gold tends to fall. This is a strong tendency rather than a lockstep rule, and other forces can override it for long stretches.
Useful data points to watch:
- US 10-year Treasury yield
- 10-year inflation expectations (TIPS spread)
- Fed funds rate expectations
US Dollar
A weaker dollar usually supports gold. The DXY (US Dollar Index) is worth tracking alongside XAU/USD.
Risk Sentiment
Gold is a safe-haven asset. During stock market selloffs, geopolitical shocks, or banking stress, gold often rallies even when other indicators are mixed.
Central Bank Activity
When central banks increase gold reserves, it adds long-term demand that does not show up in short-term charts but affects long-term trends.
Technical Analysis for Gold
Key Levels
As a historical example, traders watched the 2,000–2,400 round-number sequence during an earlier market range. Levels near the prevailing market price usually matter more than historical ones, and whether a given level holds depends on the surrounding macro and structural context.
Market Structure
Gold often trends on the daily and weekly timeframes. Multi-month breakouts and breakdowns are common. The 4H is useful for entries within a larger structure.
Volume Profile
In many periods, gold's volume clusters around macro events (CPI, NFP, FOMC) and the point of control often aligns with round numbers. After major news, volume nodes can shift and define new ranges. Whether a given tendency holds depends on the period, data source, and venue.
RSI and Moving Averages
- RSI over 70 on the daily is a warning, not a signal.
- A 50-day or 200-day moving average crossover is often cited as a potential regime change, though it is a lagging observation.
- The 200-week moving average is a long-term level many traders track.
A Practical Gold Analysis Workflow
Step 1: Check the Macro Backdrop
- What is the US 10-year yield doing this week?
- Is the dollar strong or weak?
- Are there any major risk events on the calendar (CPI, FOMC, jobs data)?
Step 2: Identify the Higher-Timeframe Structure
- Daily trend direction
- Weekly swing highs and lows
- 200-day moving average position
Step 3: Locate Key Levels
- Major psychological numbers
- Previous weekly highs and lows
- High-volume nodes
- Order blocks and fair value gaps
Step 4: Wait for Confirmation
- Break of structure in the direction of the higher timeframe
- Candlestick reaction at key level
- Volume confirmation
Step 5: Define Risk Clearly
- Entry level
- Stop below structure
- Target at the next key level
- Position size based on the stop distance
Product example: This is a product-workflow example rather than a current XAU/USD call. For a live gold review, the same layout should contain the current instrument, timestamp, data source, higher-timeframe levels, and the macro events that could invalidate a purely technical reading.
Useful AI Prompts for Gold
An AI trading assistant can speed up gold analysis significantly.
- "What is the daily and weekly structure on XAU/USD right now?"
- "Where is the point of control and value area on gold 4H?"
- "Is gold reacting near the 2,300 level as support or resistance?"
- "What macro events this week could move XAU/USD?"
- "How is the DXY correlation affecting gold right now?"
The assistant can connect technical levels to the macro context, which is where most manual analysis breaks down.
Common Mistakes in Gold Analysis
- Ignoring macro context — gold without macro is just a chart.
- Trading during high-impact news without a plan — CPI and FOMC can wipe out levels.
- Using forex-style tight stops — gold moves more per candle than most forex pairs. Size accordingly.
- Chasing breakouts — on many venues and periods, a share of gold breakouts behave like liquidity sweeps. Wait for confirmation.
- Forgetting about correlation — DXY, real yields, and silver are all part of the picture.
XAU/USD in a Multi-Asset Portfolio
For traders who follow multiple assets, gold serves three roles:
- Safe haven — gold has often held up when equities and crypto are risky, though that relationship depends on the period and macro regime.
- Macro hedge — gold is commonly discussed as a hedge against inflation and currency debasement; how well it plays that role depends on the period and real yields.
- Diversification — gold's correlation with USD pairs is different from its correlation with crypto.
If you are building a multi-asset trading approach, gold is usually a useful addition.
Building a Gold-Focused Trader Profile
If you trade gold often, your trader profile should reflect that. This example profile is illustrative, not a recommended gold policy — adapt the values to your own risk tolerance and rules.
- Preferred setups: 4H pullback to support, weekly structure breakouts
- Session focus: New York, especially around US data releases
- Risk parameters: 0.5% to 1% per trade
- Hard rule: no trading 15 minutes before or after high-impact US news
AlgoVistra supports XAU/USD analysis with multi-timeframe context, macro awareness, and prompt-driven evaluation.
Primary sources for the macro layer
The World Gold Council's research on monetary policy and gold discusses the relationship among policy expectations, yields, the dollar, and gold. Its Gold Outlook 2026 provides a current scenario framework, while its Q1 2026 central-bank demand data documents one demand component.
Those sources are contextual, not entry signals. A publishable XAU/USD case study should also include a dated chart from a named data source, the release calendar available at the time, the exact thesis and invalidation, and a later outcome review. The image above demonstrates the evidence-and-annotation layout only.
Disclaimer: AI trading assistants provide analytical insights for educational and informational purposes. They do not constitute financial advice. Always conduct your own research and use proper risk management.
Ready to Trade Smarter?
Get 10 AI chat messages per day on the free plan. No credit card required.
Forex Trading with AI: How to Analyze EUR/USD, GBP/USD, USD/JPY
A practical guide to using AI for forex market analysis, with examples for EUR/USD, GBP/USD, and USD/JPY.
May 26, 2026GuideCrypto Trading with AI: BTC, ETH, SOL Analysis Workflow
A practical workflow for analyzing Bitcoin, Ethereum, and Solana with an AI trading assistant.
May 27, 2026GuideMulti-Timeframe Analysis: How to Align Daily, 4H, and 1H Charts
Learn how to use multi-timeframe analysis to identify trend direction, key levels, and better entry timing in forex, crypto, and gold markets.
May 28, 2026