
Smart Money Concepts (SMC) Explained for Retail Traders
A beginner-friendly guide to Smart Money Concepts: liquidity, order blocks, fair value gaps, and how practitioners interpret these patterns.
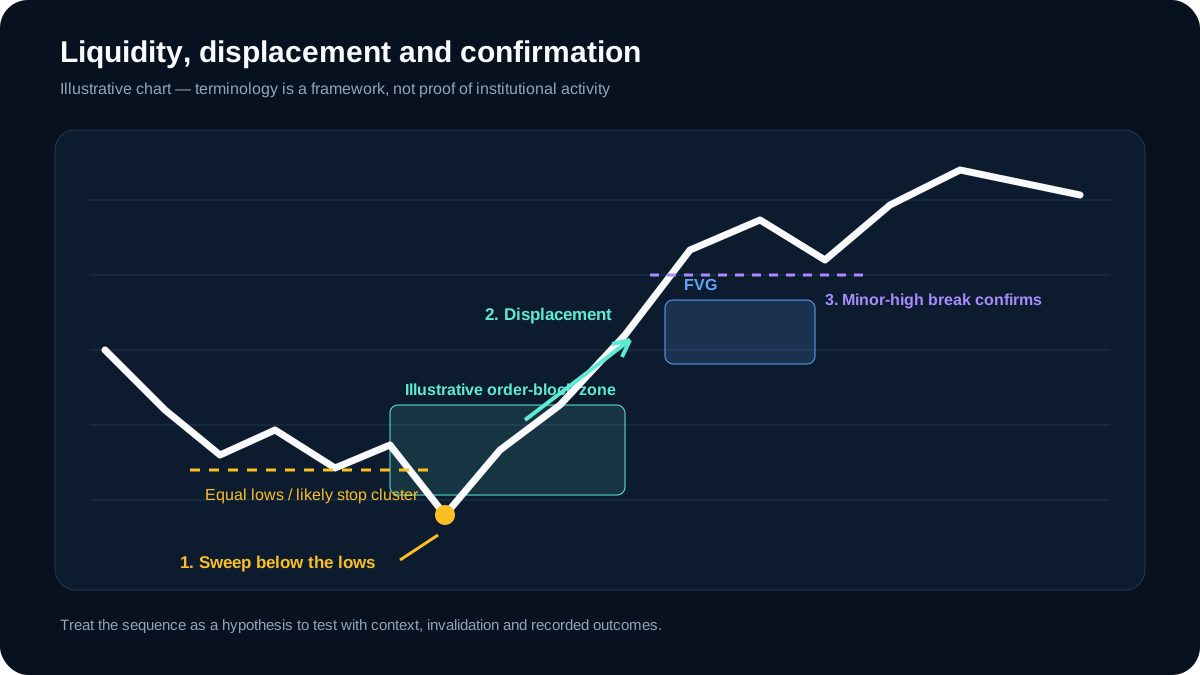
Original AlgoVistra educational diagram; illustrative only, not live market data.
Smart Money Concepts, or SMC, is a trading framework that labels recurring price-action ideas such as liquidity pools, displacement, order blocks, and fair value gaps. Practitioners often interpret these patterns as traces of large participants, but a public price chart does not directly identify who traded or why.
This guide explains the core ideas of SMC in practical terms. It is not a complete system, but it will help you understand what SMC traders look for on a chart.
What Does "Smart Money" Mean?
In SMC language, "smart money" refers to large players such as banks, hedge funds, and institutions. These participants cannot enter or exit positions at a single price. They need liquidity, which means enough buyers or sellers at specific price levels.
SMC traders believe that price often moves to where liquidity sits before continuing in the intended direction. Understanding this can help you avoid common retail traps.
Terminology note: The diagram shows how SMC practitioners label a possible stop sweep and displacement. A chart alone cannot identify the owner or intent of every order, so “institutional footprint” should be treated as an interpretation to test, not an observable fact.
Liquidity: Where Stop Orders Cluster
Liquidity in SMC means areas where a large number of stop-loss orders are likely sitting. These clusters are usually found:
- Above swing highs
- Below swing lows
- Equal highs or equal lows
- Previous major support and resistance
When price sweeps one of these levels and reverses, SMC traders call it a liquidity sweep. The idea is that large players triggered retail stop orders to fill their own positions.
How to Identify a Liquidity Sweep
- Price approaches a clear swing high or low.
- It briefly breaks above or below that level.
- It reverses sharply, leaving a wick.
- The reversal often continues in the opposite direction.
A liquidity sweep alone is not a trade signal. It becomes interesting when it combines with other SMC elements.
Order Blocks: The Interpretation
An order block is commonly defined as the last opposing candle before a strong move. Practitioners may infer that large buying or selling occurred inside that range, but a candle chart alone cannot verify that inference.
- Bullish order block — the last bearish candle before a strong bullish move
- Bearish order block — the last bullish candle before a strong bearish move
Traders watch for price to return to an order block and react, ideally with confirmation such as a smaller candle, pin bar, or break of structure.
Fair Value Gaps: Inefficiency in Price
A fair value gap (FVG) appears when price moves so quickly that it leaves a gap between candles. On most charts, this looks like a three-candle pattern where the middle candle's body does not overlap with the wicks of the candles beside it.
FVGs represent inefficiency. The theory is that price often returns to fill the gap before continuing. FVGs can act as magnets for price, especially when they overlap with order blocks or liquidity levels.
Break of Structure and Change of Character
SMC uses structure to define trend direction:
- Break of structure (BOS) — price breaks above a previous high in an uptrend, or below a previous low in a downtrend, confirming continuation.
- Change of character (CHoCH) — price breaks a previous low in an uptrend, or a previous high in a downtrend, suggesting a possible trend change.
These concepts help you identify when the market is continuing versus when it may be shifting.
Putting SMC Together
A typical SMC analysis might sound like this:
"Price swept liquidity below the previous 4H low, then reversed and broke structure to the upside. It is now retesting a bullish order block with a fair value gap inside. If price holds here, the next target is the recent swing high."
This is a narrative, not a signal. The trader still needs to define entry, stop, target, and risk.
SMC Limitations
SMC is popular, but it is not magic. Common pitfalls include:
- Overfitting — seeing order blocks and FVGs everywhere
- Ignoring context — SMC works best with trend and macro alignment
- No risk rules — concepts alone do not protect your account
- Subjectivity — two traders may label the same chart differently
Use SMC as one lens among many, not the only one.
How AI Can Help With SMC
AI trading assistants can detect and explain SMC concepts faster than manual labeling. You can ask:
- "Are there any clear liquidity sweeps on GBP/USD 1H?"
- "Mark the most recent order blocks on BTC/USDT."
- "Where are the fair value gaps on EUR/USD 4H?"
- "Is the structure showing BOS or CHoCH on XAU/USD?"
The assistant can speed up your analysis and help you learn the language of SMC in real chart context.
AlgoVistra supports SMC-style analysis including order blocks, fair value gaps, liquidity zones, BOS, and CHoCH.
What is observable and what is inferred
Swing highs, swing lows, candle ranges, and reported venue volume are observations. “Stops sit here,” “institutions accumulated here,” and “price moved to collect liquidity” are interpretations. Keep those layers separate in both prompts and journal records.
The NBER paper Foundations of Technical Analysis describes the subjectivity problem in visual pattern recognition and offers a systematic way to test selected patterns. The CFA Institute review of technical trading rules emphasizes false discoveries, persistence tests, and costs. There is no cited source here that independently validates SMC as a complete profitable system; the guide explains its vocabulary and how to test a precise version.
Disclaimer: AI trading assistants provide analytical insights for educational and informational purposes. They do not constitute financial advice. Always conduct your own research and use proper risk management.
Ready to Trade Smarter?
Get 10 AI chat messages per day on the free plan. No credit card required.
Order Blocks, Fair Value Gaps, and Liquidity Zones: A Practical Guide
Learn how to identify and use order blocks, fair value gaps, and liquidity zones in your market analysis.
May 31, 2026GuideMarket Structure: BOS vs CHoCH in Forex and Crypto
Learn the difference between Break of Structure (BOS) and Change of Character (CHoCH), and how to use them to read trend direction and potential reversals.
May 30, 2026GuideGold Trading Analysis: XAU/USD Key Levels and Macro Context
How to analyze gold (XAU/USD) using macro context, key levels, market structure, and an AI trading assistant.
June 8, 2026