
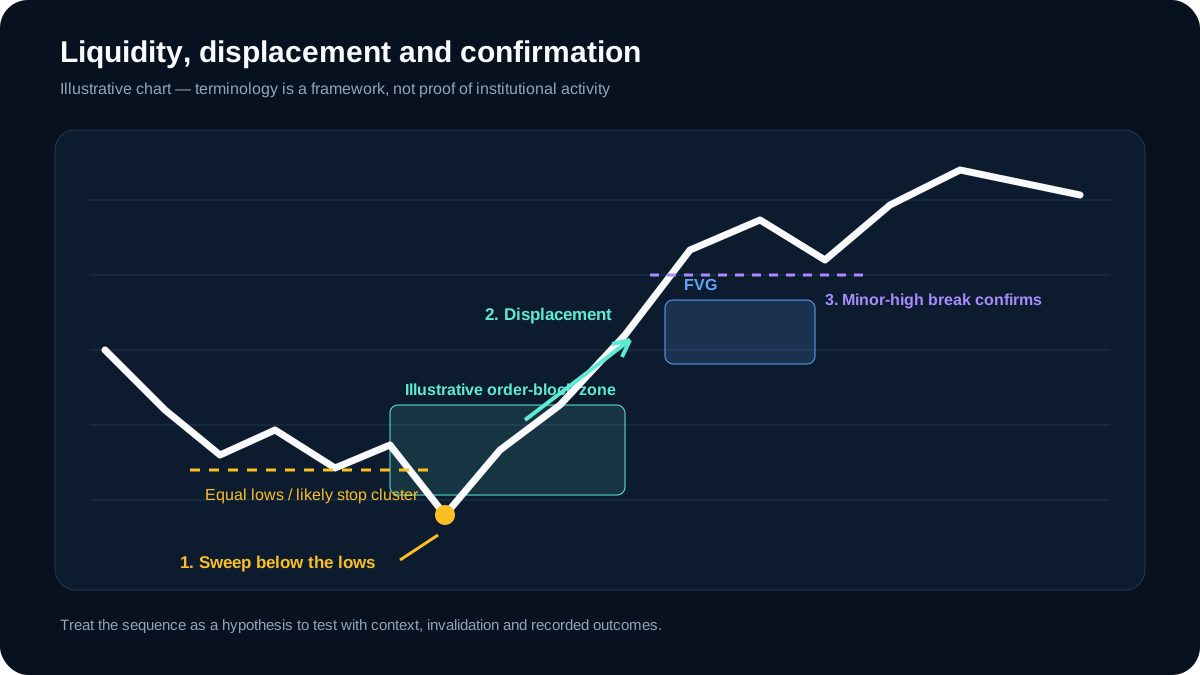
Original AlgoVistra educational diagram; illustrative only, not live market data.
Three concepts appear often in modern technical-analysis communities: order blocks, fair value gaps, and liquidity zones. They provide a vocabulary for describing displacement, possible reaction areas, and levels where stop orders may cluster. Those interpretations must still be defined and tested.
This guide breaks down each concept and shows how to combine them.
Order Blocks
In common SMC usage, an order block is the final opposing candle before a strong directional move. Practitioners may interpret its range as an area where large orders were absorbed, but the candle alone does not reveal participant identity or guarantee a later reaction.
How to Identify an Order Block
- Look for a strong impulsive move, usually several candles in one direction.
- Find the last candle that moved against that impulse.
- That candle's range becomes the order block.
For a bullish order block, the last bearish candle before a strong rally is the zone. For a bearish order block, the last bullish candle before a strong drop is the zone.
How to Use Order Blocks
Traders watch for price to return to an order block and react. A reaction might include:
- A smaller candle forming inside the block
- A pin bar or engulfing pattern
- A break of structure in the expected direction
- Volume confirmation
Order blocks are not exact levels. They are zones, so give them room.
Fair Value Gaps
A fair value gap (FVG) is a price interval left behind by a strong move. In the three-candle convention used throughout this guide, consider three consecutive candles and measure the interval between candle 1 and candle 3. A bullish FVG is the gap between candle 1's high and candle 3's low when candle 3's low stays above candle 1's high; a bearish FVG is the gap between candle 1's low and candle 3's high when candle 3's high stays below candle 1's low. Definitions vary by methodology — some use candle bodies instead of wicks, or require particular candle types — so this guide states its convention explicitly and applies it consistently. The gap shows a range price moved through quickly; it does not mean no orders sat inside it.
Why FVGs Matter
Under this convention, price frequently returns toward an FVG before continuing in the original direction, so some traders watch for a pullback to end inside the zone. That tendency is a hypothesis to test on your own market and timeframe, not a rule.
Types of FVGs
- Bullish FVG — price leaves a gap to the upside; the gap may act as support on a pullback.
- Bearish FVG — price leaves a gap to the downside; the gap may act as resistance on a retracement.
How to Use FVGs
Use FVGs to plan entry zones. If you are bullish and price has just broken out, wait for a pullback into a bullish FVG. If the FVG holds, it can offer a lower-risk entry than chasing the breakout.
Liquidity Zones
Liquidity zones are price levels where a large number of stop-loss orders are likely placed. Some traders treat these areas as possible price objectives, because clustered orders may increase available liquidity. The chart alone does not prove that price will reach them.
Common liquidity zones include:
- Swing highs and lows
- Equal highs and equal lows
- Major round numbers
- Previous support and resistance
When price briefly sweeps one of these levels and reverses, it is called a liquidity sweep. The move can trap breakout traders and collect their stop orders, though participant intent is inferred from the price action rather than observed.
How to Use Liquidity Zones
Liquidity zones help you:
- Avoid placing stops in obvious locations
- Anticipate where price might spike before reversing
- Identify potential reversal areas
- Understand why a "clean" breakout failed
How to read the diagram: The sequence is a hypothesis: stops may cluster below comparable lows, a sweep may precede displacement, and a minor-high break may add confirmation. These labels do not prove who placed the underlying orders.
Combining the Three Concepts
The real power comes from combining order blocks, FVGs, and liquidity zones. A high-confluence setup might look like this:
- Liquidity sweep — price briefly takes out a swing low, collecting sell stops.
- Order block reaction — price reverses into a bullish order block.
- FVG fill — the pullback fills a bullish fair value gap inside the order block.
- Confirmation — a candle closes strongly, breaking a minor high.
This is not a guaranteed trade. It is a higher-confluence area where multiple concepts overlap.
Example on BTC/USDT
Imagine BTC/USDT is in an uptrend on the 4H. Price makes a strong move from $66,000 to $68,000. The last bearish candle before the rally becomes a bullish order block around $66,400. A fair value gap sits inside that block from $66,450 to $66,550.
Later, price pulls back, briefly dips below a recent 1H low to collect liquidity, then enters the order block and FVG zone. It forms a bullish engulfing candle and breaks the recent 1H high. A trader might use this confluence to consider a long, with a stop below the order block.
Common Mistakes
- Labeling every candle as an order block — order blocks should come before strong moves.
- Treating FVGs as exact prices — they are zones, not pinpoints.
- Ignoring the trend — these concepts work best when aligned with market structure.
- No invalidation — always define where the setup is wrong.
How AI Helps
Manually labeling order blocks, FVGs, and liquidity zones on every chart takes time. An AI trading assistant can do it in seconds. Useful prompts include:
- "Mark the most relevant order blocks on EUR/USD 4H."
- "Where are the fair value gaps on ETH/USDT?"
- "Is there a liquidity sweep happening on XAU/USD?"
- "Show me confluence between order blocks and FVGs on GBP/USD."
The assistant can also explain why a particular zone matters and how it fits into the broader structure.
AlgoVistra detects order blocks, fair value gaps, and liquidity zones across supported forex, crypto, and gold markets.
Terminology and validation limits
Price and public volume data can show candles, gaps between selected candle ranges, and reactions around predefined levels. They do not reveal the identity or intent of every participant. Define each concept operationally—for example, the exact three-candle FVG rule, the candle range used for an order block, and the tolerance for “equal” highs—before measuring outcomes.
The NBER study Foundations of Technical Analysis describes subjectivity as a central obstacle in evaluating chart patterns. The CFA Institute review of false discoveries and transaction costs shows why testing many technical rules can produce false positives and why apparent performance must persist out of sample after costs. Neither is proof of order blocks or FVGs; both supply the evaluation standard.
Disclaimer: AI trading assistants provide analytical insights for educational and informational purposes. They do not constitute financial advice. Always conduct your own research and use proper risk management.
Ready to Trade Smarter?
Get 10 AI chat messages per day on the free plan. No credit card required.
Smart Money Concepts (SMC) Explained for Retail Traders
A beginner-friendly guide to Smart Money Concepts: liquidity, order blocks, fair value gaps, and the difference between chart evidence and interpretation.
May 29, 2026GuideMarket Structure: BOS vs CHoCH in Forex and Crypto
Learn the difference between Break of Structure (BOS) and Change of Character (CHoCH), and how to use them to read trend direction and potential reversals.
May 30, 2026GuideVolume Profile Trading: HVN, LVN & POC Explained
Master volume profile trading with our complete guide to High Volume Nodes, Low Volume Nodes, and Point of Control.
June 1, 2026