
Market Structure: BOS vs CHoCH in Forex and Crypto
Learn the difference between Break of Structure (BOS) and Change of Character (CHoCH), and how to use them to read trend direction and potential reversals.
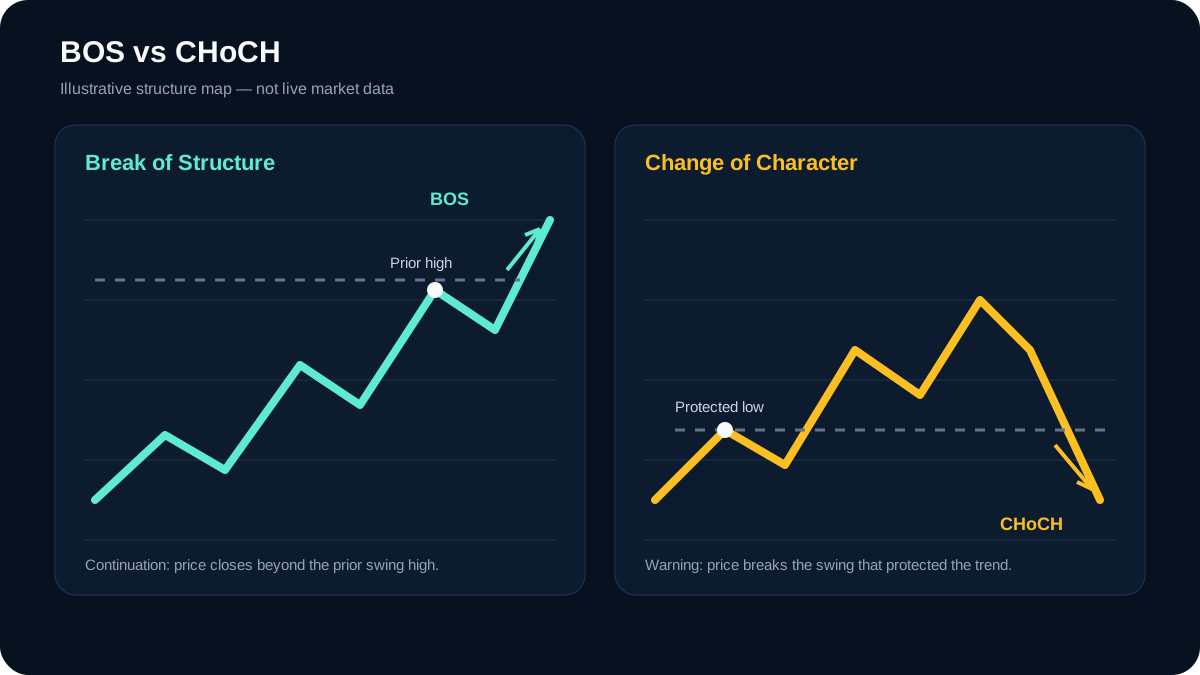
Original AlgoVistra educational diagram; illustrative only, not live market data.
Market structure is the skeleton of price movement. It tells you whether buyers or sellers are in control, where the trend is likely continuing, and when the balance may be shifting. Two of the most useful structural concepts are Break of Structure (BOS) and Change of Character (CHoCH).
Understanding these two ideas will improve how you read charts, set directional bias, and avoid low-probability counter-trend trades.
What Is Market Structure?
Market structure is simply the pattern of swing highs and swing lows. In its simplest form:
- Uptrend — price makes higher highs and higher lows.
- Downtrend — price makes lower highs and lower lows.
- Range — price stays between two horizontal levels without a clear higher-high or lower-low sequence.
Your first job as a trader is to identify which structure is in control. Everything else sits on top of that.
Break of Structure (BOS)
A Break of Structure marks a new price extreme beyond the prior swing and is treated by many traders as evidence that the current trend is continuing.
In an uptrend, BOS happens when price breaks above the previous swing high. In a downtrend, BOS happens when price breaks below the previous swing low.
Why BOS Matters
BOS is read as a sign that the dominant side is still winning. Buyers are strong enough to push price to a new high, or sellers are strong enough to push it to a new low. It often acts as evidence that the trend remains intact.
How Traders Use BOS
Traders use BOS to:
- Confirm trend continuation
- Avoid entering counter-trend positions
- Identify potential pullback entry zones
- Set logical profit targets at the next structural level
BOS is not an entry signal by itself. It is treated as evidence that the broader direction is still valid.
Change of Character (CHoCH)
A Change of Character suggests that the current trend may be losing momentum and direction could be changing.
In an uptrend, CHoCH happens when price breaks below the previous swing low. In a downtrend, CHoCH happens when price breaks above the previous swing high.
Why CHoCH Matters
CHoCH is the first sign that the market structure is shifting. It does not guarantee a full reversal, but it invalidates the idea that the trend is still clean and one-sided.
How Traders Use CHoCH
Traders use CHoCH to:
- Reduce exposure in the direction of the old trend
- Watch for reversal setups
- Adjust bias from bullish to neutral, or bearish to neutral
- Wait for a higher-timeframe confirmation before reversing
CHoCH is a warning sign, not a trade trigger.
How to read the diagram: BOS describes continuation through the prior structural extreme. CHoCH is an early warning that the swing protecting the trend has failed. The paths are schematic, not historical price data.
BOS vs CHoCH: Side by Side
| Concept | Meaning | Directional Signal |
|---|---|---|
| BOS in uptrend | Breaks above prior high | Trend continues up |
| BOS in downtrend | Breaks below prior low | Trend continues down |
| CHoCH in uptrend | Breaks below prior low | Trend may be changing |
| CHoCH in downtrend | Breaks above prior high | Trend may be changing |
Timeframe Matters
BOS and CHoCH look different on each timeframe. A CHoCH on the 15-minute chart may just be noise within a strong daily uptrend. A CHoCH on the daily chart carries much more weight.
This is why multi-timeframe analysis is important. Always check the higher timeframe structure before acting on a lower-timeframe CHoCH.
Common Mistakes
- Trading every CHoCH — many CHoCH patterns fail and become continuation after a deeper pullback.
- Ignoring the higher timeframe — a 1H CHoCH against a daily BOS is usually low probability.
- Using BOS as an automatic buy signal — BOS marks trend continuation but does not tell you where to enter or stop.
- Forgetting confirmation — look for candlestick reaction, volume, or additional confluence.
Practical Example: EUR/USD
Suppose EUR/USD daily is in an uptrend. On the 4H chart, price makes a higher high, then pulls back and makes a higher low. When price breaks above the recent 4H high, that is a BOS marking continued structure in the uptrend.
Later, price fails to make a new high and breaks below the recent 4H higher low. That is a CHoCH. At this point, a trader might reduce long exposure, move stops to breakeven, or wait to see if a reversal setup forms.
How AI Helps
An AI trading assistant can quickly identify whether a chart is showing BOS or CHoCH across timeframes. Useful prompts include:
- "Is EUR/USD 4H showing BOS or CHoCH?"
- "What is the market structure on BTC/USDT daily?"
- "Did XAU/USD just change character on the 1H?"
- "Which timeframe is controlling the structure on GBP/USD?"
The assistant can also explain how the structure fits with volume profile, order blocks, and macro context.
AlgoVistra supports market structure analysis including BOS and CHoCH detection for forex, crypto, and gold pairs.
Make the labels testable
Before reviewing outcomes, define the swing algorithm: left/right pivot width, whether a wick or close counts as a break, minimum displacement, timeframe, and how equal highs or lows are handled. Have two reviewers label the same blinded sample and measure agreement. Then test the frozen definition on a later period with costs. Without that protocol, BOS and CHoCH can become hindsight labels.
The NBER paper Foundations of Technical Analysis explicitly identifies subjectivity in visual chart patterns and demonstrates one systematic pattern-recognition approach. A later CFA Institute review of technical trading tests highlights data-snooping, out-of-sample persistence, and transaction costs. Neither source validates BOS or CHoCH specifically; they explain why precise definitions and out-of-sample testing matter.
Disclaimer: AI trading assistants provide analytical insights for educational and informational purposes. They do not constitute financial advice. Always conduct your own research and use proper risk management.
Ready to Trade Smarter?
Get 10 AI chat messages per day on the free plan. No credit card required.
Order Blocks, Fair Value Gaps, and Liquidity Zones: A Practical Guide
Learn how to identify and use order blocks, fair value gaps, and liquidity zones in your market analysis.
May 31, 2026GuideSmart Money Concepts (SMC) Explained for Retail Traders
A beginner-friendly guide to Smart Money Concepts: liquidity, order blocks, fair value gaps, and the difference between chart evidence and interpretation.
May 29, 2026GuideForex Trading with AI: How to Analyze EUR/USD, GBP/USD, USD/JPY
A practical guide to using AI for forex market analysis, with examples for EUR/USD, GBP/USD, and USD/JPY.
May 26, 2026